A new e-resources usage statistics dashboard

New usage statistics dashboard alert! Check it out at https://whheresourceusage.shinyapps.io/dash/. Drop me a line here or on twitter and let me know how much you love it.

screenshot of the new e-resources usage statistics dashboard

New dashboard alert!

***
For the last several years I have been annually publishing the usage statistics of our library’s licensed e-resources, using a Google Sites dashboard that my colleague @mars_bar85 designed. We started developing the dashboard in summer 2013, after constructing a brief document about our decisions and goals for the dashboard. The resulting dashboard still looks good after all these years:  https://library.sites.google.com/site/eresstatistics/home.

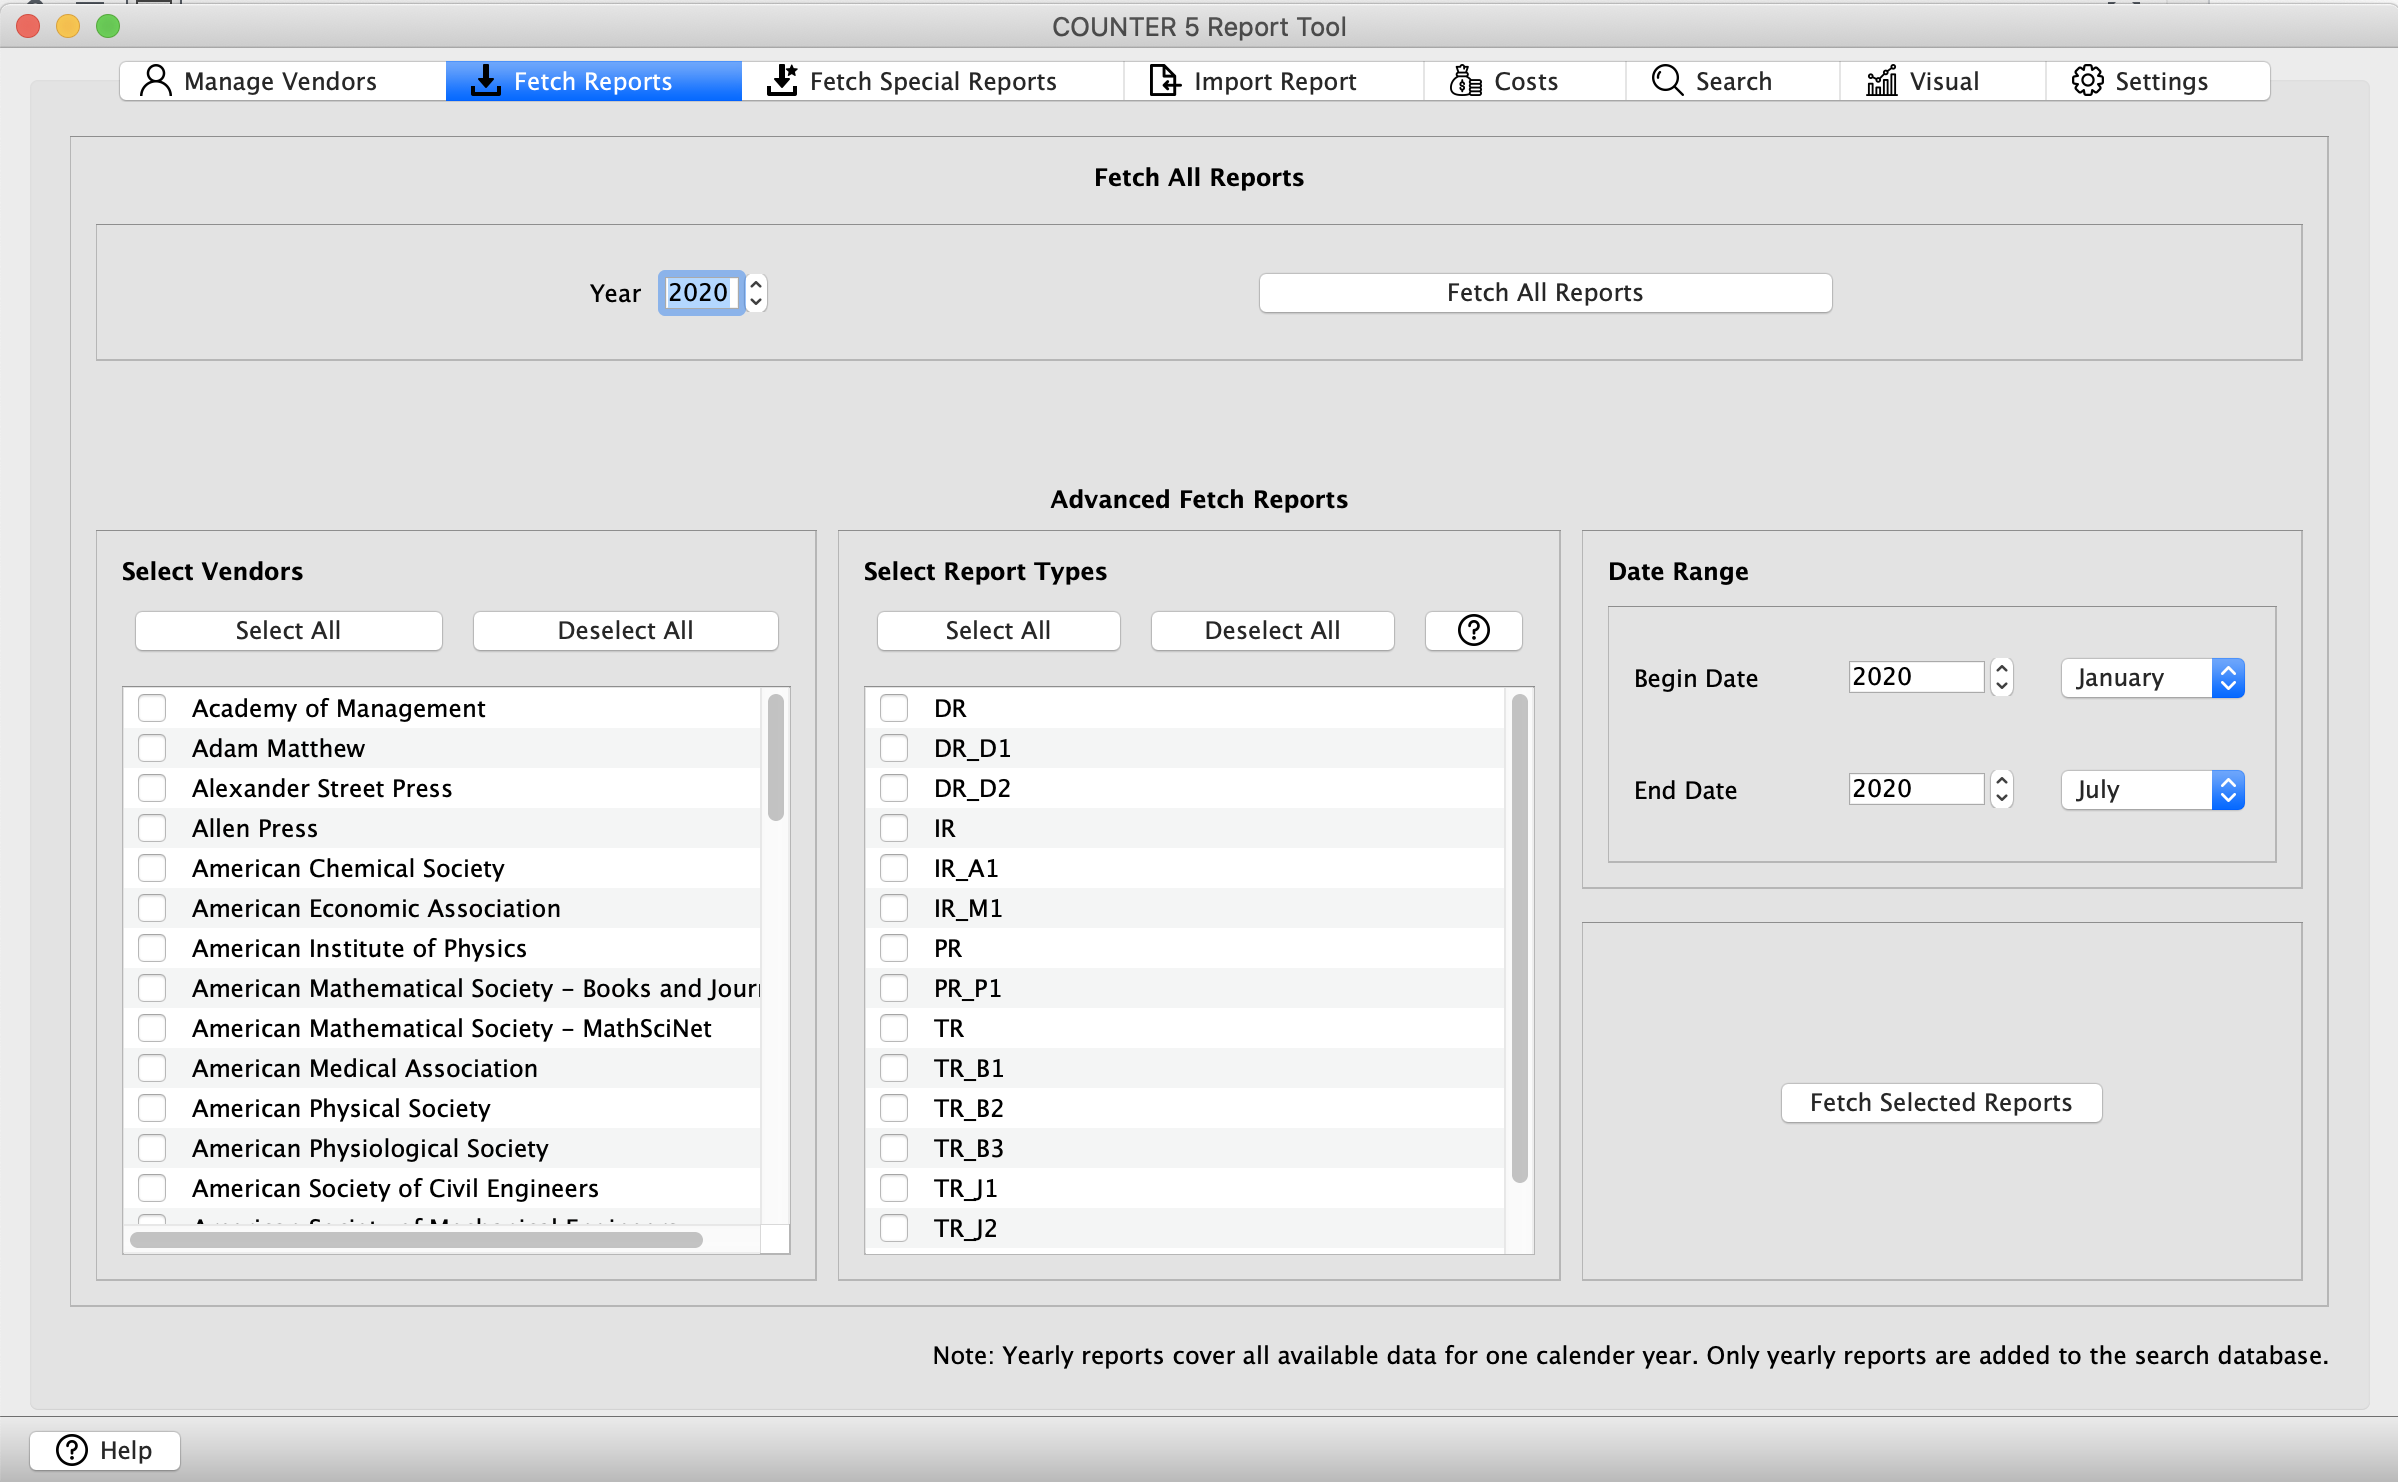
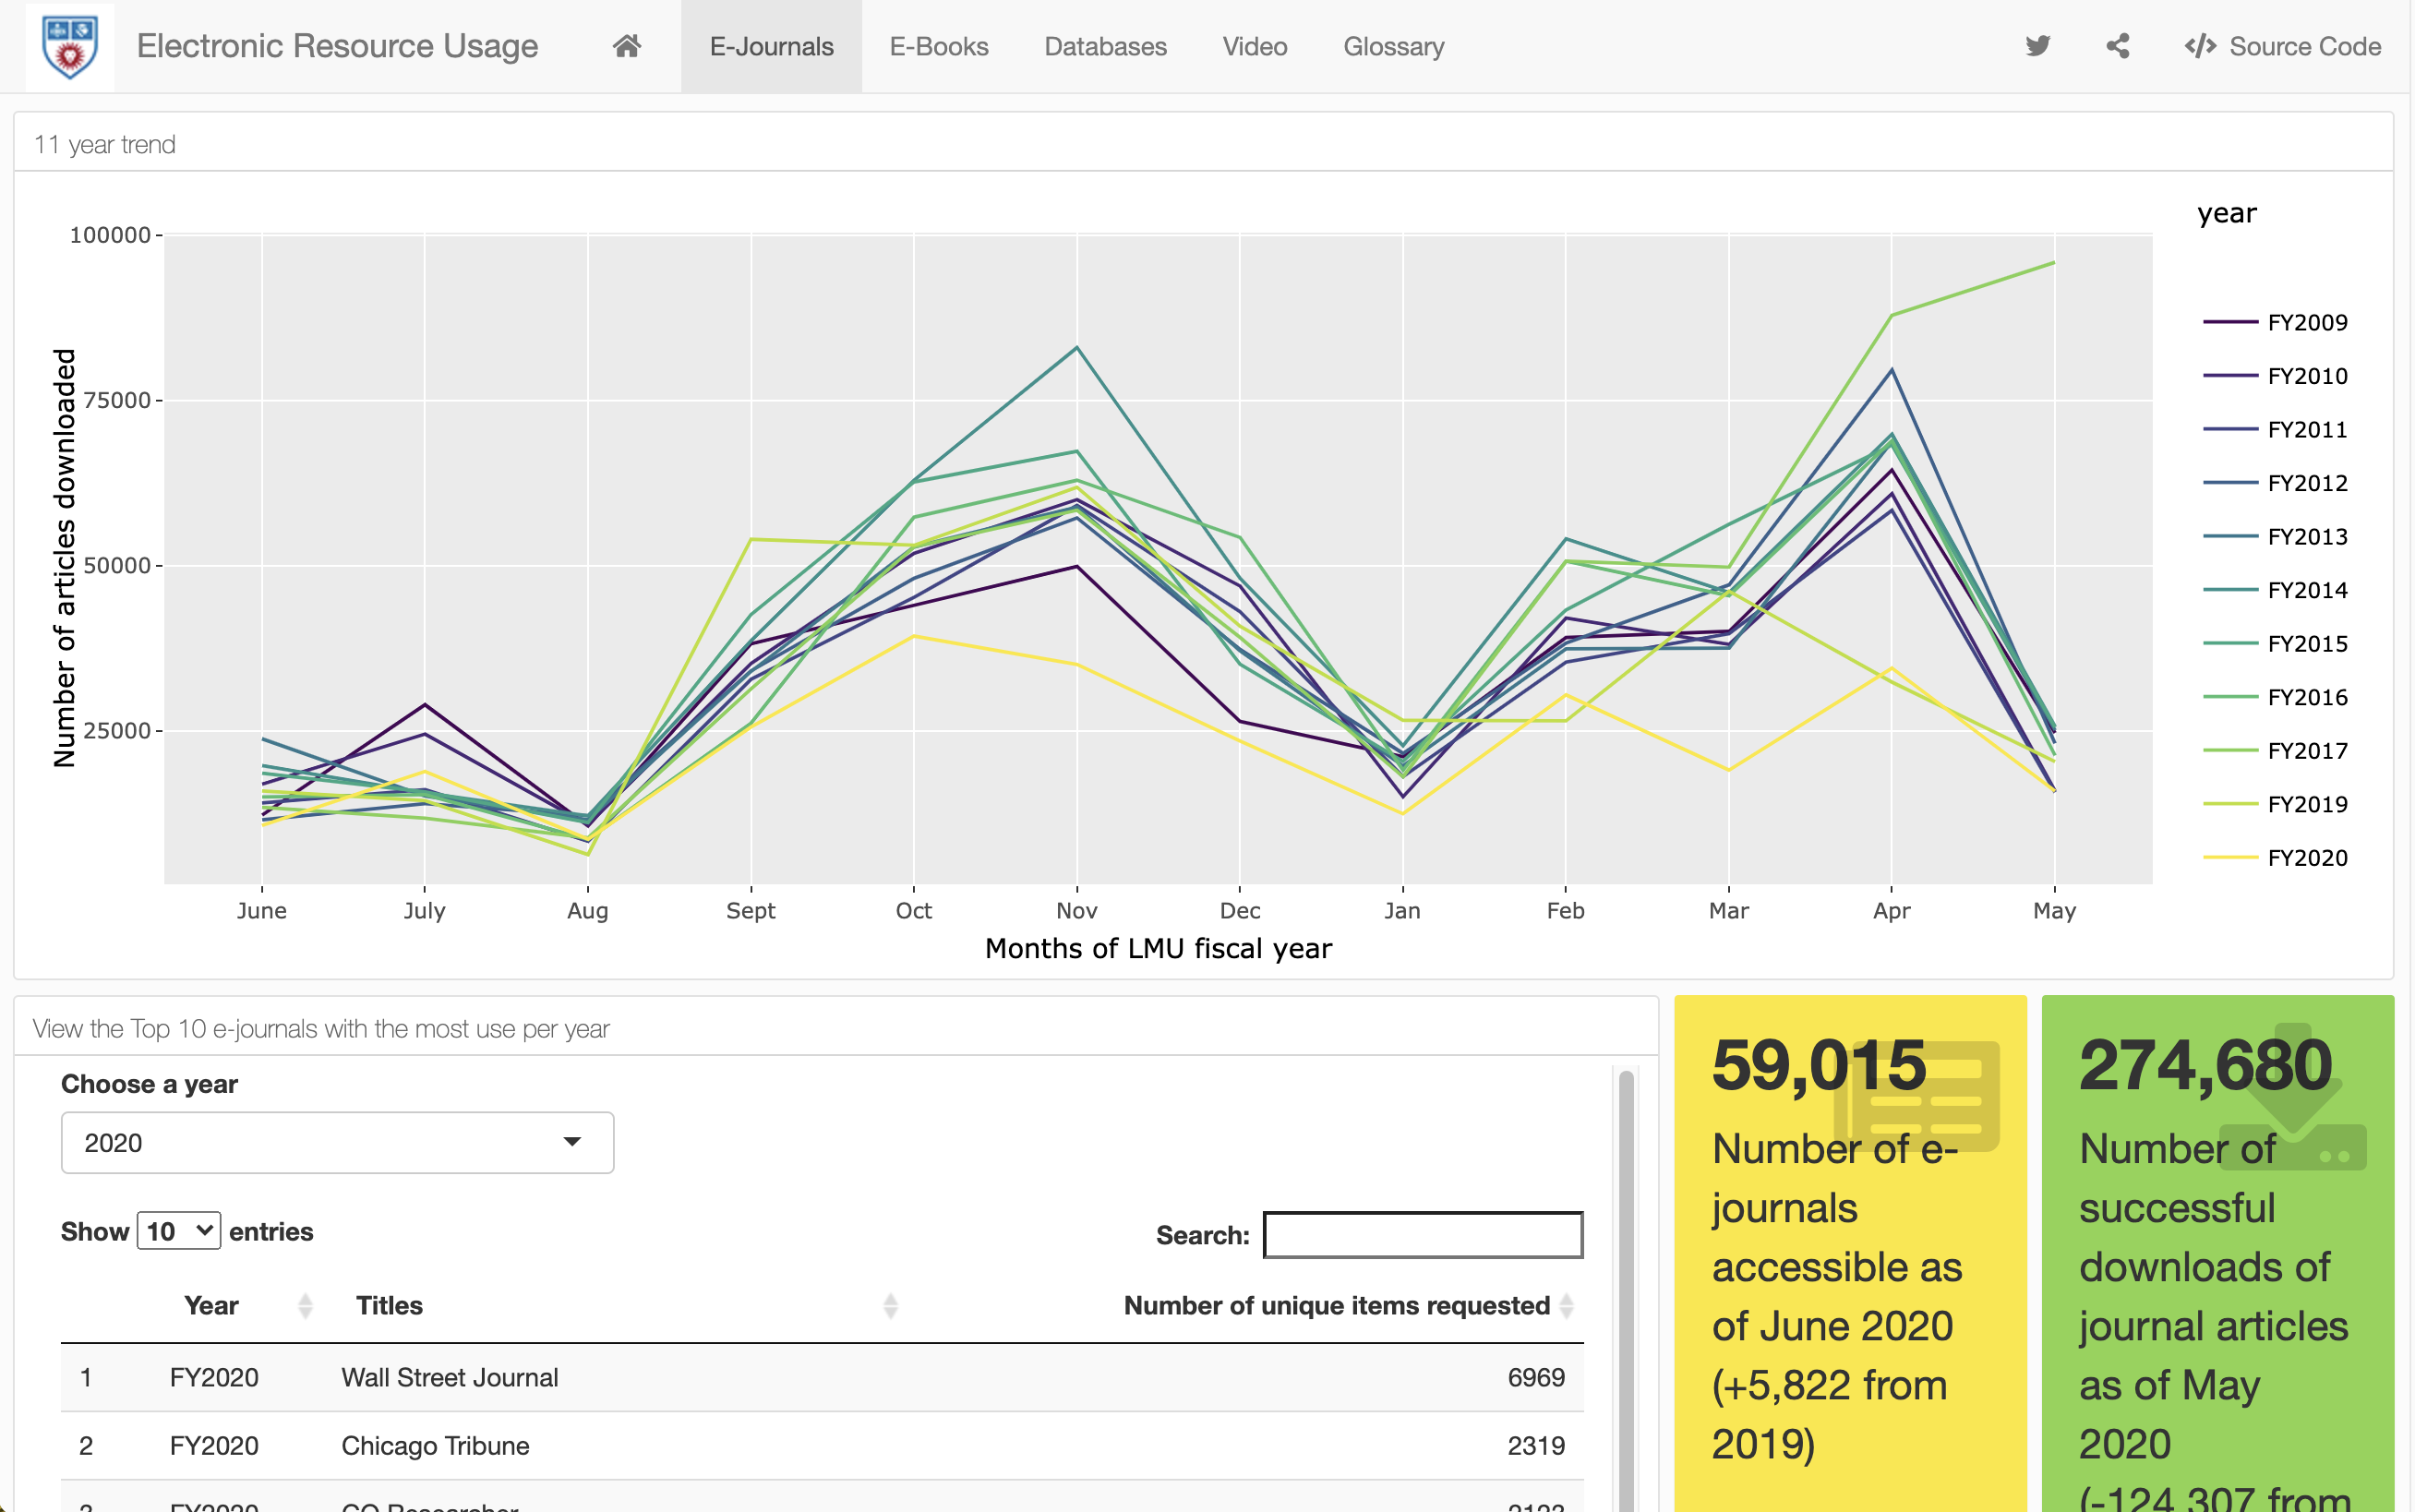
Over this past year I’ve been learning R (mainly just for fun) and have grown really interested in the coding behind summary visualizations of data. I wanted to put into practice what I was learning so I decided to update the e-resources usage statistics dashboard to include interactive elements, and this time build it in R. I used a flexdashboard with some shiny components, and it is housed (a free account) at https://whheresourceusage.shinyapps.io/dash/. The components I’ve programmed in the dashboard allow for user interaction and more dynamism than our old dashboard. It’s time for this change. The most exciting component of the new dashboard is an interactive table of all of our licensed databases and their usage statistics. The users of the dashboard can now search on demand to see the usage of any database they’re interested in, rather than emailing me to ask for those stats. Users can sort alphabetically or by usage, to see our most-used/least-used databases, and can download the data for offline manipulation.

This new dashboard still adheres to our original goals of wanting “to communicate … simply, clearly, and quickly about electronic resource usage,” and now it does it in a more engaging way.

Any feedback on the new dashboard is welcome, I’m still learning! The source code is available on the site -> https://whheresourceusage.shinyapps.io/dash/

Posted in e-resource mgmt, library, usage statistics | 2 Comments

What do we mean by decolonizing research strategies?

Continuing on, reading about approaches to conducting research that roots the research agenda within a community, conceived and conducted in concert with community members, for the benefit of the community. This week’s reading is an analytic review of participatory action-research projects, with the author looking to see what can be learned from those bottom-up or grass-roots approaches to inform decolonized research strategies.

I will post here some passages that stood out to me, for further reflection. The first passage is about the term decolonization. The author, Miguel Zavala, discusses the fraught use and wider definition of the term, landing with his own interpretation for this work: “I define ‘decolonization’ as anti-colonial struggle that grows out of grassroots spaces” (p.57).

In the section of the article about decolonizing research within academia (or “Euroversity”), Zavala notes that, “With respect to research methodologies, we have seen the development of approaches that honor the perspectives, voices, and interests of the communities being studied. This kind of research is encapsulated by the transformative, participatory role communities assume when they take ownership of the research process; the ‘objects’ of the study become the ‘subjects’ of the entire research process, thus changing the paradigm of traditional research methodologies” (p.66).

In closing, Zavala comments that, “What is asked for here is for Indigenous and Raza scholars to become students of the formation of grassroots organizations that are generating alternative, collective education and research projects” (p.68).

This article has led me to think about power as part of the research process, who has it, who doesn’t, and how that plays out throughout and entire research agenda. From the development of the research question, to how data is proposed to be gathered, the collection and analysis of data, and who has access to the results and how the results will be used.

Zavala, M. (2013). What do we mean by decolonizing research strategies? Lessons from decolonizing, indigenous research projects in New Zealand and Latin America. Decolonization: Indigeneity, Education & Society 2(1), 55 – 71.


Posted in articles i'm reading | Comments Off on What do we mean by decolonizing research strategies?

Critical Race Methodology: Counter-Storytelling as an Analytical Framework for Education Research

I’ve started doing a bit of reading about ways of thinking differently about traditional social science research methods, as part of a group activity with the IRDL Scholars. Today I read a piece by Daniel G. Solórzano and Tara J. Yosso, about counter-storytelling as a method to ground research from the perspective of the non-majority voice. I learned some new terminology, which I will post here as a reminder for myself (and perhaps will be useful to you as well!). The “definitions” are my own interpretation based on my reading of the terms in use in the article.

Majoritarian story: story told from the perspective of a person in the cultural majority

Deficiency model: some class of person does not have a key characteristic (a biological trait such as being a person of color, as an example used in the article) to succeed, as judged by the dominant culture

Counter-storytelling has at least 3 forms: personal stories or narratives (using a first-person voice); other people’s stories or narratives (using a third-person voice); composite stories or narratives

They also provide a really clear distinction between a method and a methodology:

According to Sandra Harding (1987), a research method is a technique for gathering evidence such as interviews, focus groups, participant observation, ethnographies, and surveys. On the other hand, research methodology is “a theory and analysis of how research does or should proceed” (p. 3). We define methods as the specific techniques used in the research process, such as data gathering and analysis. Whether we use quantitative, qualitative, or a combination of methods depends on which techniques of data gathering and analysis will best help us answer our research questions. We define methodology as the overarching theoretical approach guiding the research. For us, methodology is the nexus of theory and method in the way praxis is to theory and practice. In other words, methodology is the place where theory and method meet. (Endnote 2, p.38)

Solórzano, D. G., & Yosso, T. J. (2002). Critical Race Methodology: Counter-Storytelling as an Analytical Framework for Education Research. Qualitative Inquiry8(1), 23–44. https://doi.org/10.1177/107780040200800103

Posted in articles i'm reading | Comments Off on Critical Race Methodology: Counter-Storytelling as an Analytical Framework for Education Research

COUNTER 5 SUSHI harvester

Annually I compile COUNTER usage statistics of our licensed e-resources to contribute to our library’s national reports and to update our local e-resources statistics dashboard. Until last year this was a manual process requiring a significant amount of time. I would need to log in to a separate administrative portal of over 60 platforms, to download Excel spreadsheets of usage data for over 350 resources. Because we report based on our fiscal year (June 1 start) I would need to download two calendar-year spreadsheets and then combine them into one. Compiling all of the disparate data into three categories of e-journals, e-books, and databases, and then condensing it into bite-sized pieces (e.g., bar charts of use per month, top 10 e-journals) for our stakeholders took the longest amount of time. I frequently had help downloading the reports and was often rushed in condensing the data, arguably the most important part of even having the data.

Last year we subscribed to a service (RedLink) that would fetch those reports for us, using the SUSHI protocol. Setting up the service took a while, to discover the correct server URLs for each platform, requesting the creation of an API key that would give the service permission to download reports on our behalf, and then to convey that data to the service provider. I was elated that my annual compilation took far less time, and I could better enjoy the process.

This spring I was alerted that the service was going out of business. I considered several other commercial SUSHI harvesting services, but they were significantly more expensive than our subscription to RedLink had been. It seemed to me to be poor stewardship of our library’s funds to request a more expensive service in the midst of a global pandemic and uncertain budgetary future. I started looking for freely available services and was discouraged at EBSCO’s R5 Harvester tool (requires Microsoft Access and a Windows computer, neither of which I currently have). I was soon delighted, however, to come across Melissa Belvadi’s COUNTER 5 SUSHI harvester.

I installed it on my Mac with ease, downloaded the vendor lists file (a starter file, with many of the vendors we use) and manually entered the SUSHI credentials into the tool. Within an afternoon I was able to start fetching reports and adjusting the credentials for some finicky vendors. I really like that I can export into a single file all of the vendor credentials, so that I can share that file with another member of our team, and they can import it and fetch reports.

All of the data presented on our e-resources stats dashboard for the latest fiscal year was generated from this tool. I am so grateful to have a freely available tool that is also easy to use. Thank you to the team that built it!

Screen shot of the COUNTER 5 SUSHI harvester tool

Screen shot of the COUNTER 5 SUSHI harvester tool

Posted in e-resource mgmt, usage statistics | Comments Off on COUNTER 5 SUSHI harvester

California Cheese Trail

You know that question people sometimes like to ask, “If you were going to die tomorrow, what would your last meal be?” Pretty ominous question, come to think of it. But my answer is always, “A warm baguette, grapes, wine, and a variety of cheeses.” Dave often delights me by bringing home from the grocery store cheeses we haven’t tried before, gathered from the basket in the cheese area of end pieces and sample sizes.

We really ended up living in a great area of the United States. California has its own tourism sector, related to cheese: California Cheese Trail. I want to eventually go visit them in person and maybe pet some goats and cows. Since we’ve had to stay at home during the pandemic lockdown we’ve decided to start a virtual tour, ordering from three of the cheesemakers on the list so far. Our first order was from Cowgirl Creamery, a women-owned company. Next we tried Nicasio Cheese, a family-owned business. And just today our order from Petaluma Creamery arrived.

If you’re a fan of other California cheeses, fill me in, I’d love to try them.

October 19 update: just placed an order from Vella Cheese Company!

February 2021 update: ordered from Point Reyes Farmstead!

March 2021 update: ordered from Stepladder Creamery!

A picture of a map of California cheesemakers

Posted in monkeys/bananas | Comments Off on California Cheese Trail

A new “Scholarship that cites my work” section of my annual review

I usually start drafting my annual performance review report in the spring, in anticipation of finishing it before the start of the next fiscal year (June 1 start). Now that I have attained Librarian status, which is the highest promotion level at my institution, I can begin to reflect not just on what was accomplished during the year, but what impact my scholarship has had on the profession. An easy way to think about that is to look at the numbers of citations to publications over the years. My Google Scholar profile shows the articles and books I’ve written/co-authored and the number of times they’ve been cited over time. I wondered though, about how many times they’ve been cited simply over this last year.

I asked #AcademicTwitter if they report this in their own performance review reports. The main response I got from my question was that it was a good idea, so I thought I’d give it a try. This year I added a new section to the professional development part of my report, titled, “Scholarship that cites my work.” It took a bit of time to click through the Google Scholar profile to the citing articles, and count them if they had been published in our last fiscal year (June 2019-May 2020). What I found, though, was that a lot of my work was being used in the profession, not just one or two articles. I’ll see what kind of response I get from those reviewing my report, to decide if I want to continue to include those data in future reports.

Here’s a screen shot of the section from my report:

A new Works Cited section of my annual review

Posted in twitter, writing | Comments Off on A new “Scholarship that cites my work” section of my annual review