embed a flickr slideshow on your website

flickr now allows you to embed a slideshow of your images on a website or blog.  find a set of images you like, click on ‘slideshow’, and then when the show starts, hover your mouse in the upper right hand of the screen and click on ‘share’. you can choose to paste a link on your site that takes the viewer back to the flickr site to play the slideshow or you can paste some code to have the slideshow play right on your web page. i should note that you can’t share others’ images this way, just your own, and you need to be logged in to your flickr account to see the share code.

here’s a slideshow of a few of my images:

Posted in art, images | Comments Off on embed a flickr slideshow on your website

authorized user

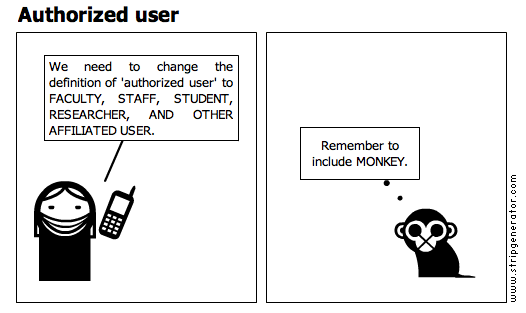
Part of my job is to negotiate license agreements for the electronic resources my library acquires. There are always a few sections of a license that need to be rewritten to fit our organization; one of those is the section on defining who is allowed to use the resource, the “authorized users.” The usual language of a license defines an authorized user group as “faculty and student,” but at my university we have researchers who are neither faculty or students, clinicians that don’t have faculty status, etc. I usually propose the following definition for “authorized user”: faculty, staff, student, researcher, and other affiliated user. I don’t usually propose adding “monkey” to the category.

authorized user

Posted in comic, e-resource mgmt | 1 Comment

the path to enlightenment, or at least useful statistics

We’re in the midst of gathering the usage statistics for our electronic journal collection.  Our titles are mixed in with the rest of USC’s electronic journals.  Here’s how we’re extricating our titles from the giant list of subscribed journals.

  1. Pulled COUNTER Journal Report 1 stats from 13 vendors/aggregators.
  2. Deleted all header information from each report, leaving behind title, publisher, gateway, print issn, e-issn, and a column for each month (july 07-june 08)
  3. Compiled all reports into one giant Excel file.
  4. Pulled our title list from our in-house electronic resource database into an Excel file, added 16 columns after each title, with each cell containing HSL, coloring all cells pink.
  5. Merged our title list into the giant Excel file, sorted by title.
  6. We’re now going through this 15,000 row file, line by line, title matching.  If there is a row with usage statistics that matches a pink row, we keep the statistics.  If there is no match that means the title belongs to the main campus library, and we discard it from our count (i.e., delete the row).
  7. At the end we should have a file of statistics that we can then sum, giving us a total number of successful PDF downloads for our fiscal year.

Why are we causing ourselves so much pain, going through the titles like this? We initially looked for a join feature but there aren’t any fields that match consistently enough to merge the files automatically (not all titles are entered the same way, not all titles have print or e-issns, etc.). We subscribe to a commercial electronic resource management system that does not allow for ‘ownership’ to be identified in their system, so our titles are mixed in with the main campus titles without a way to distinguish who bought what. This time consuming process is the only way we can think to gather our data. I’m posting this with the hope that a reader will have a suggestion for us. We’re willing to experiment!

Posted in e-resource mgmt, usage statistics | 1 Comment

the academic process

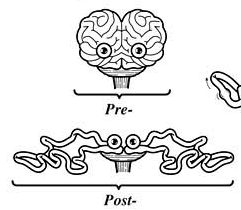
i’m so enjoying looking at all the parts of the illustrations in my anatomy, by tom giesle. here’s a portion of plate 5, which i think perfectly sums up the academic process.

a portion of Plate 5 of Tom Giesle's My Anatomy portfolio

and this is a visualization of how i feel before and after completing a manuscript:

Posted in art | 1 Comment