
“A dashboard is a visual display of the most important information needed to achieve one or more objectives: consolidated and arranged on a single screen so the information can be monitored at a glance” (Few, p.34).
Wow, there are some really unattractive dashboards out there. When we were wondering if we should make a dashboard for all of our e-resource usage stats and charts we did a Google search to see what we could crib from. Word of advice: if you’re thinking about creating a dashboard and you’re not well-versed in visual design, check this book out before you get rolling: Few, Stephen. 2006. Information Dashboard Design: The Effective Visual Communication of Data. O’Reilly: North Sebastopol, CA.
We’re at the point now of deciding what will be stored in and linked from the dashboard, as well as what format it will take. We’re considering a wiki-based design, web-based, LibGuide (which is web-based but v. customizable), and a simple Excel dashboard.
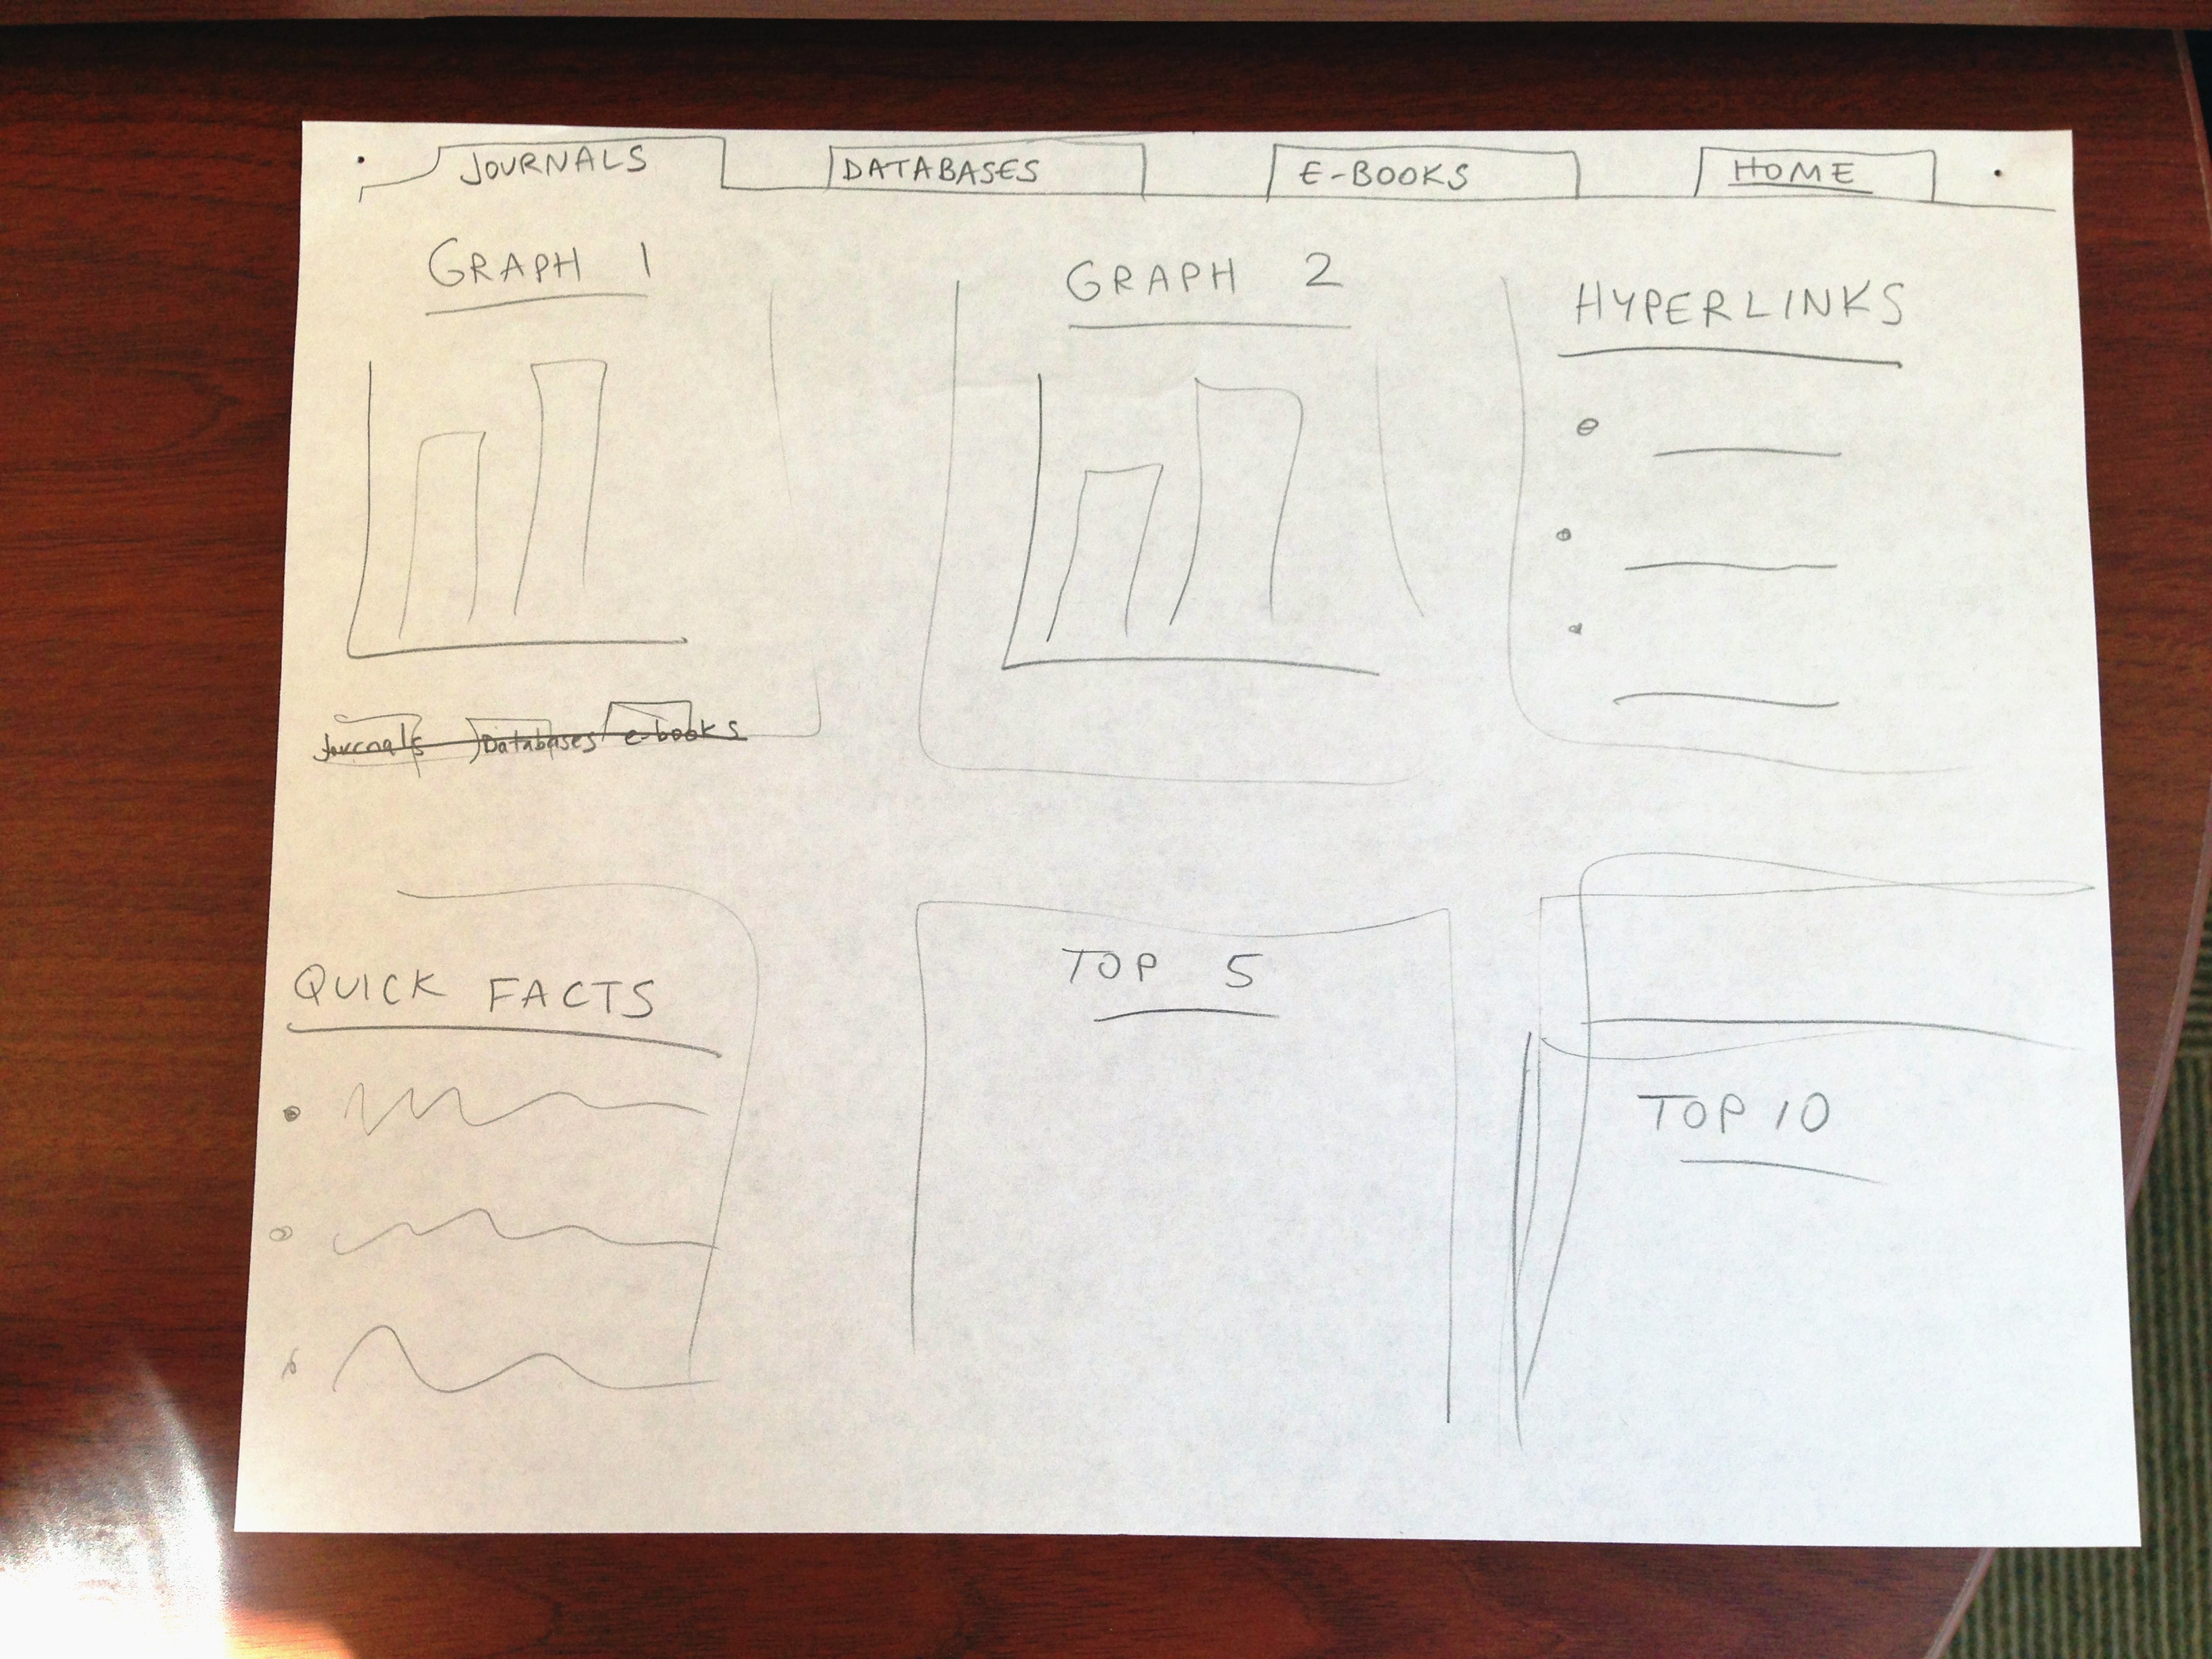
Here’s a visual draft of what we’re thinking about now. Stay tuned for more!
If you decide to go LibGuides, you’d be able to share it with other institutions! (Says the fellow LibGuides member, not unselfishly).
oh, that’s right, in libguides you can crib someone’s entire libguide. i’ll have to give this serious thought. it is very appealing to think that ours could act as a template to save other libraries from having to create from scratch. thanks!
Great start. I have been working on something similar but it certainly is a massive undertaking. I am thinking of using your set-up but also including some of our print circulation stats…perhaps to use as comparison and also to house the data all in one place. Keep us posted, thanks!