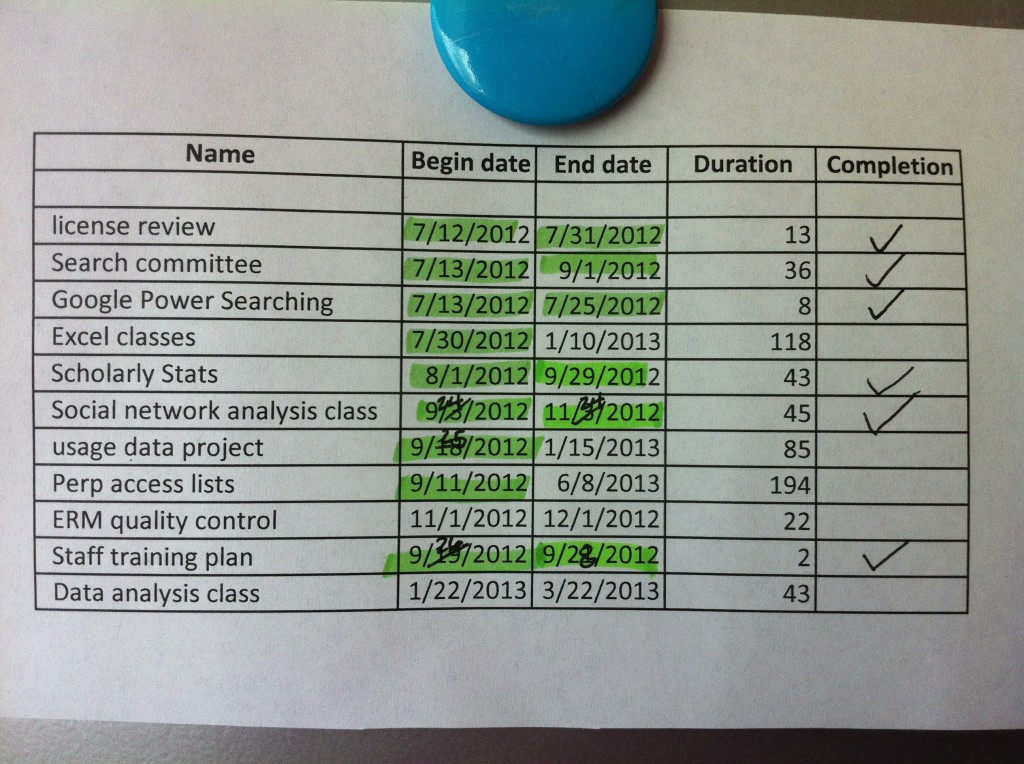
Four months ago I shared an abbreviated Gantt chart I made for myself at work, to keep my too-many tasks from getting out of control this year. Sure, I could have decided to try to do less, which would negate the need for such a thing, but apparently “doing less” is not in my nature.
I thought I’d show you what my chart looks like today. A few more tasks made it on to the list, start/end dates have been adjusted, and I’m way behind on my quality control project.
I’m really liking sharing the chart with people when they ask me to join a committee or work on a project. It’s an easy visual way to communicate when my free-er times of the year are, and when I’m totally jammed up with existing projects. If the first four months of using this kind of project-tracker are any indication, I’ll be using this kind of thing again next year.


