e-resources usage stats dashboard

“A dashboard is a visual display of the most important information needed to achieve one or more objectives: consolidated and arranged on a single screen so the information can be monitored at a glance” (Few, p.34).

Wow, there are some really unattractive dashboards out there. When we were wondering if we should make a dashboard for all of our e-resource usage stats and charts we did a Google search to see what we could crib from. Word of advice: if you’re thinking about creating a dashboard and you’re not well-versed in visual design, check this book out before you get rolling: Few, Stephen. 2006. Information Dashboard Design: The Effective Visual Communication of Data. O’Reilly: North Sebastopol, CA.

We’re at the point now of deciding what will be stored in and linked from the dashboard, as well as what format it will take. We’re considering a wiki-based design, web-based, LibGuide (which is web-based but v. customizable), and a simple Excel dashboard.

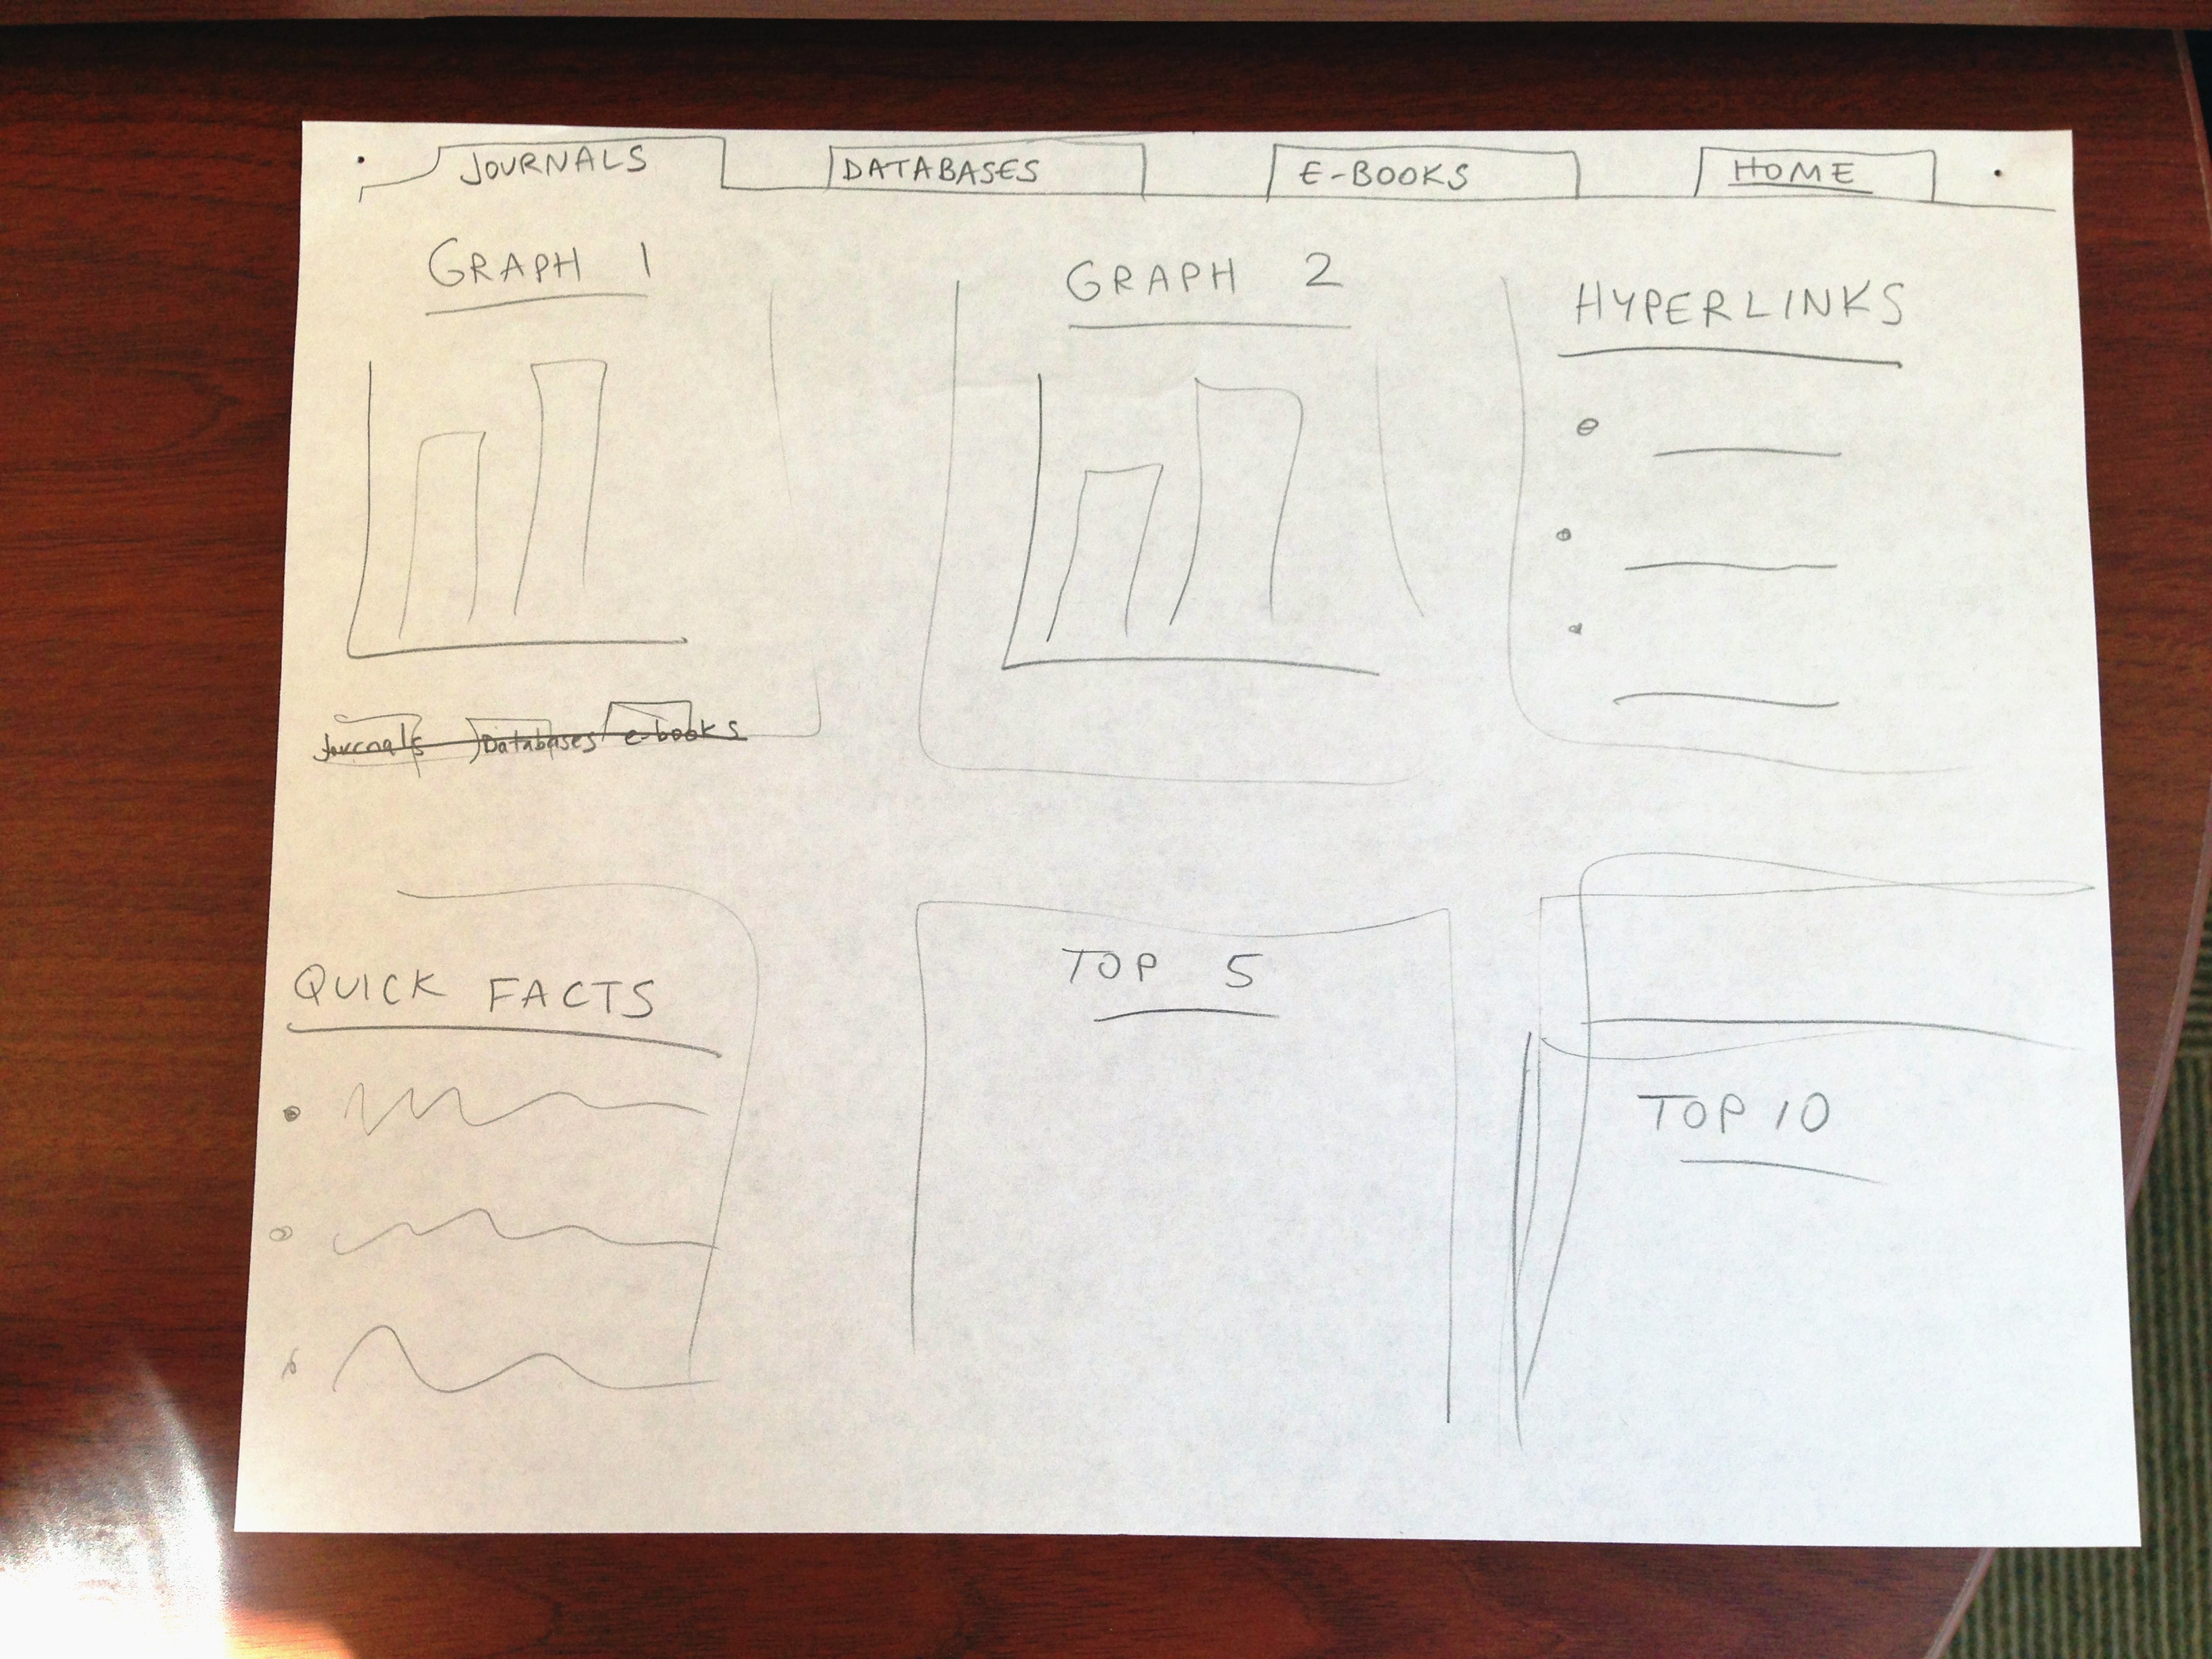
Here’s a visual draft of what we’re thinking about now. Stay tuned for more!

stats dashboard hand drawing

Posted in e-resource mgmt | 3 Comments

One good thing about asking the question

…is that you’re gonna get an answer!

Librarians who serve our patrons at service points are THE people to stay in touch with if you’re thinking about how to improve your library’s electronic resources. I stopped by the Info Desk to chat with the librarian there today and she mentioned what a drag it was to have the link one clicks on to get to an e-book look so nondescript. People never know where to click. Look at the image I’ve put here. Why would anyone ever think that clicking on “ebrary” would take them to the e-book? It’s ridiculous. It’s also already on the list of things to discuss library-wide, to come to some consensus about how it should look, and what the link should say. I reminded the librarian that this was definitely on the list of things to correct.

Then I asked, “What else ya’ got?” And guess what? The librarian had more ideas about what to change, how things might work better for our patrons. How awesome is that? My take-home of the day is to keep asking that question.

awful link that nobody knows how to use

Posted in e-resource mgmt | Comments Off on One good thing about asking the question

Proxy server anxiety dreams

Anxiety dreams comic

On August 1 we will go live with a new proxy server, giving more reliable off-campus access to our licensed electronic resources. This means that during the month of July we’ll be changing every one of the URLs in our system, tens of thousands of them. We’re pretty organized but I can’t help but worry that a few URLs will slip through the cracks. Send us good vibes!

http://stripgenerator.com/strip/754601/anxiety-dreams

Posted in comic, e-resource mgmt | 3 Comments

The door’s locked

The door’s locked. — Ofelia
In that case, create your own door. — The faun

Pan’s Labyrinth

Posted in writing | Comments Off on The door’s locked

ikea monkey air freshener

oh dear.
ikea monkey air freshener

lingonberry scented? i can’t even.

http://www.neatoshop.com/product/Runaway-Monkey-Air-Freshener

related blog post about the ikea monkey: http://orgmonkey.net/?p=1591

Posted in monkeys/bananas | Comments Off on ikea monkey air freshener

qualitative AND quantitative

I recently attended the Qualitative and Quantitative Methods in Libraries conference in Rome, Italy, and had a blast. What a treat to see librarians and library researchers from across the globe present the results of their mixed methods research. It was especially nice to not have to explain why one would want to use both qual and quant at the same time, but rather it was just accepted that using both is how some really well informed research gets done.

We presented the results of two new research projects (my co-investigator is David P. Kennedy of RAND). Listed here are our abstracts and links to presentation slides.

  1. Developing a Mixed Qualitative and Quantitative Research Design to Inform Library Policy Decision-making

    When faced with the need to make decisions about library policies, such as offering new services, discontinuing existing services, or marketing underutilized services, administrators often need to better understand patron expectations of the library. For example, if new services do not meet the expectations of patrons, these services may not be used or appreciated and resources devoted to developing these new services may be wasted. Also, if existing services are seen as essential to patrons’ expectations of a functioning library, patrons may react negatively to discontinuation of these services. In addition, communicating with patrons about policy changes without fully understanding their expectations my result in marketing campaigns that are ineffective, misunderstood or ignored. Therefore, understanding shared patron conceptualizations of library functions is essential to successful policy development and implementation.

    In this presentation, we provide an extended example of a mixed qualitative and quantitative research design for identifying the shared conceptualization of library functions. We discuss methods of collecting and analyzing data from the field of cognitive anthropology, including freelisting, pile sorting, and cultural consensus analysis. These methods are designed to explore a domain of information that may or may not have strong cultural agreement, to identify the culturally salient elements of this domain, to identify which elements are core elements and which are peripheral, and to provide a means of testing if there is cultural agreement for the domain in a particular population. We will apply these methods to the domain of a library’s function on a university campus in the United States and discuss the usefulness of these methods to the development and implementation of library policy.

    http://www.slideshare.net/orgmonkey/qqml-d-kennedy

  2. The “Use” of an Electronic Resource from a Social Network Analysis Perspective

    Academic libraries in the United States commonly employ COUNTER or proxy server statistics to describe the use of their electronic resources, but we know that a “use” is arguably more than a full-text download or web page “hit.” This presentation reports on an analysis of data gathered at the Loyola Marymount University (Los Angeles, California) from library reference encounters with patrons during which an electronic resource is mentioned. Social network analysis is used to examine the relationship between a patron, a librarian, and an electronic resource to more fully describe the use of the resource. This research provides a framing mechanism for comparison between traditional COUNTER statistics, proxy server statistics, and the social network analysis perspective.

    http://www.slideshare.net/orgmonkey/the-use-of-an-electronic-resource-from-a-social-network-analysis-perspective

We’re working on writing up the results for publication, soon-ish. 🙂 Let me know if you’d like an advanced peek at either of the two articles.

Here are two twitter screen shots about our presentations:

tweet1
tweet2

Posted in e-resource mgmt, library, social networking, twitter, writing | Comments Off on qualitative AND quantitative