“A dashboard is a visual display of the most important information needed to achieve one or more objectives: consolidated and arranged on a single screen so the information can be monitored at a glance” (Few, p.34).
Wow, there are some really unattractive dashboards out there. When we were wondering if we should make a dashboard for all of our e-resource usage stats and charts we did a Google search to see what we could crib from. Word of advice: if you’re thinking about creating a dashboard and you’re not well-versed in visual design, check this book out before you get rolling: Few, Stephen. 2006. Information Dashboard Design: The Effective Visual Communication of Data. O’Reilly: North Sebastopol, CA.
We’re at the point now of deciding what will be stored in and linked from the dashboard, as well as what format it will take. We’re considering a wiki-based design, web-based, LibGuide (which is web-based but v. customizable), and a simple Excel dashboard.
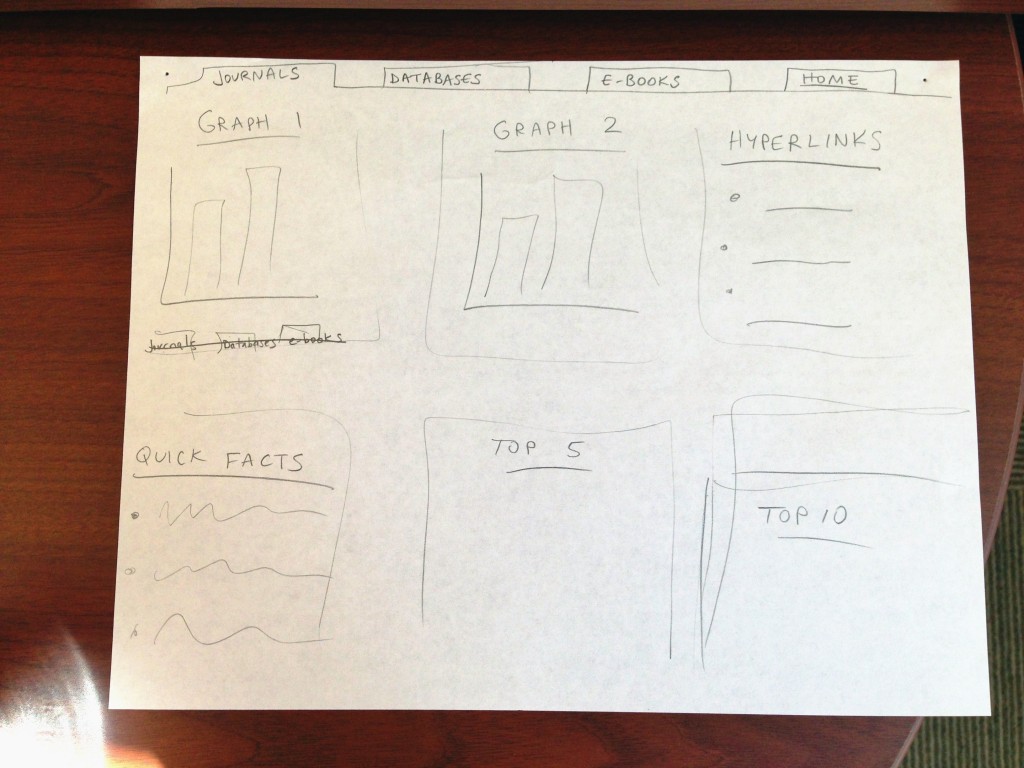
Here’s a visual draft of what we’re thinking about now. Stay tuned for more!


